We're excited to announce the launch of our pprof Profile Sharing service, that is free and open to the public. This service allows you to upload a profile from your machine and share it anywhere, simply with link.
Profile Sharing Workflow
We built this service to be useful for pull requests or issues on GitHub/GitLab so you can share an interactive profile to describe the problem better than simply stating it. But we’re most excited to see how people will utilize this service in ways we haven’t thought of yet!
When you navigate to share.polarsignals.com you’ll be greeted with an opportunity to upload your own profile.
You can select any pprof file from your computer up to 2MB in size to upload. Make sure to give your profile a description of what the profile is, to give people you share it with a better idea of what they’re looking at. For example, you can upload a profile before and after making optimizations, and illustrate that in the description.
Once uploaded you’ll receive a short link that you can share anywhere! Here’s an example link of a memory profile of Conprof: https://share.polarsignals.com/8c73116/
On the shared profile page you’ll land on the graph view by default. This allows you to see the call graphs of functions and the resource amount each function is consuming.
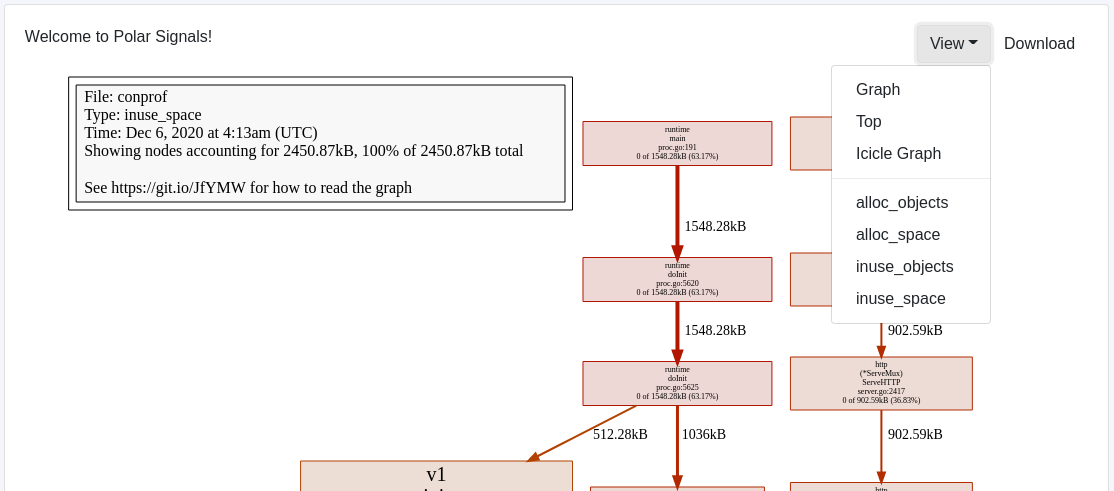
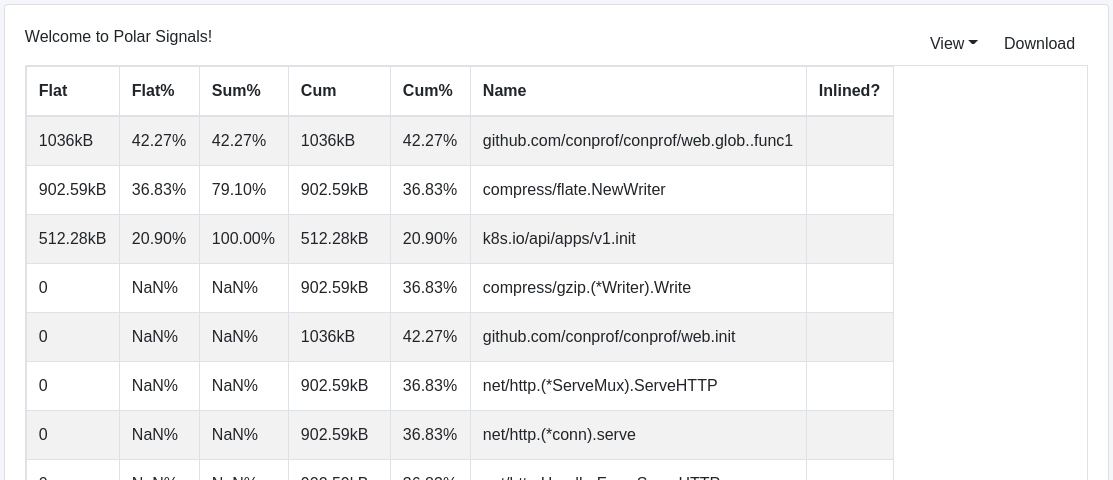
By selecting the View dropdown menu you can have it display the profile in other formats. Such as Top which lists the functions in a sorted table.
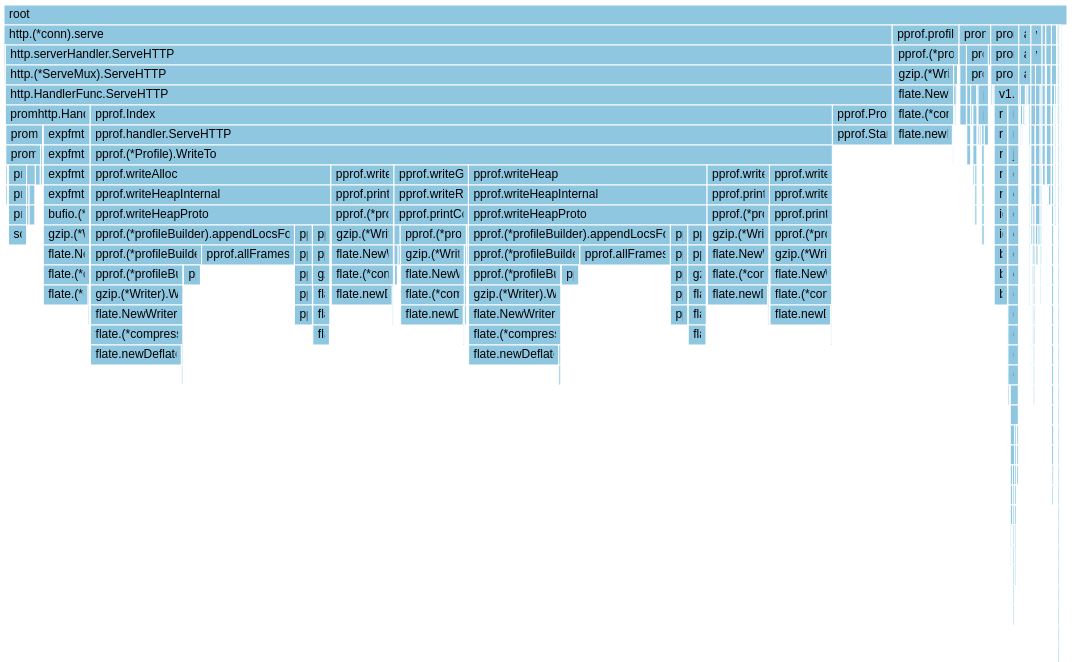
Or Icicle graph which is a nice visualization for quickly understanding how a program is behaving.
We hope that this will give the community a way to demonstrably make performance optimizations that everyone can visualize and understand.
So start profiling your programs and sharing the profiles!