ATTENTION: ArcticDB has been renamed to FrostDB. Check out the blog post.
End of last year we announced the Parca Open Source project and today we are excited to introduce arcticDB, an embedded columnar database written in Go building on top of Apache Parquet and Apache Arrow, powering Parca going forward.
This blog post describes why we built it and what drove specific features and requirements, but if you’re just interested in how it works, check out the project README.
Continuous profiling needs a columnar database
Continuous profiling is the systematic and always-on profiling of software. We built and open sourced Parca to make it available to everyone. At Polar Signals our goal is to allow users to always profile their infrastructure with zero instrumentation. Using the eBPF based Parca Agent, we are enabling the collection of CPU profiling data at very low overhead. However, while we are able to collect the data at low overhead, it produces a huge amount of data to store and query efficiently.
Profiling data at a high level can be described as stacktraces with a value attached, so continuous profiling is the same, except it adds the time dimension. Take some example data:
| Stacktrace | t1 | t2 | t3 | ... | | ---------------- | --- | ---- | ---- | --- | | main;func1;func2 | 2 | 3 | null | ... | | main;func1;func3 | 23 | null | 234 | ... |
To make querying multi-dimensional data familiar, the data model of Parca, is highly inspired by Prometheus' data model. For example to select all profiling data of a specific node a label-selector is used to query it:
cpu{node=”123.my-node-pool.polarsignals.com”}
Labels can be anything. Infrastructure labels such as region, datacenter, node, etc. or application specific labels such as version are popular labels used.
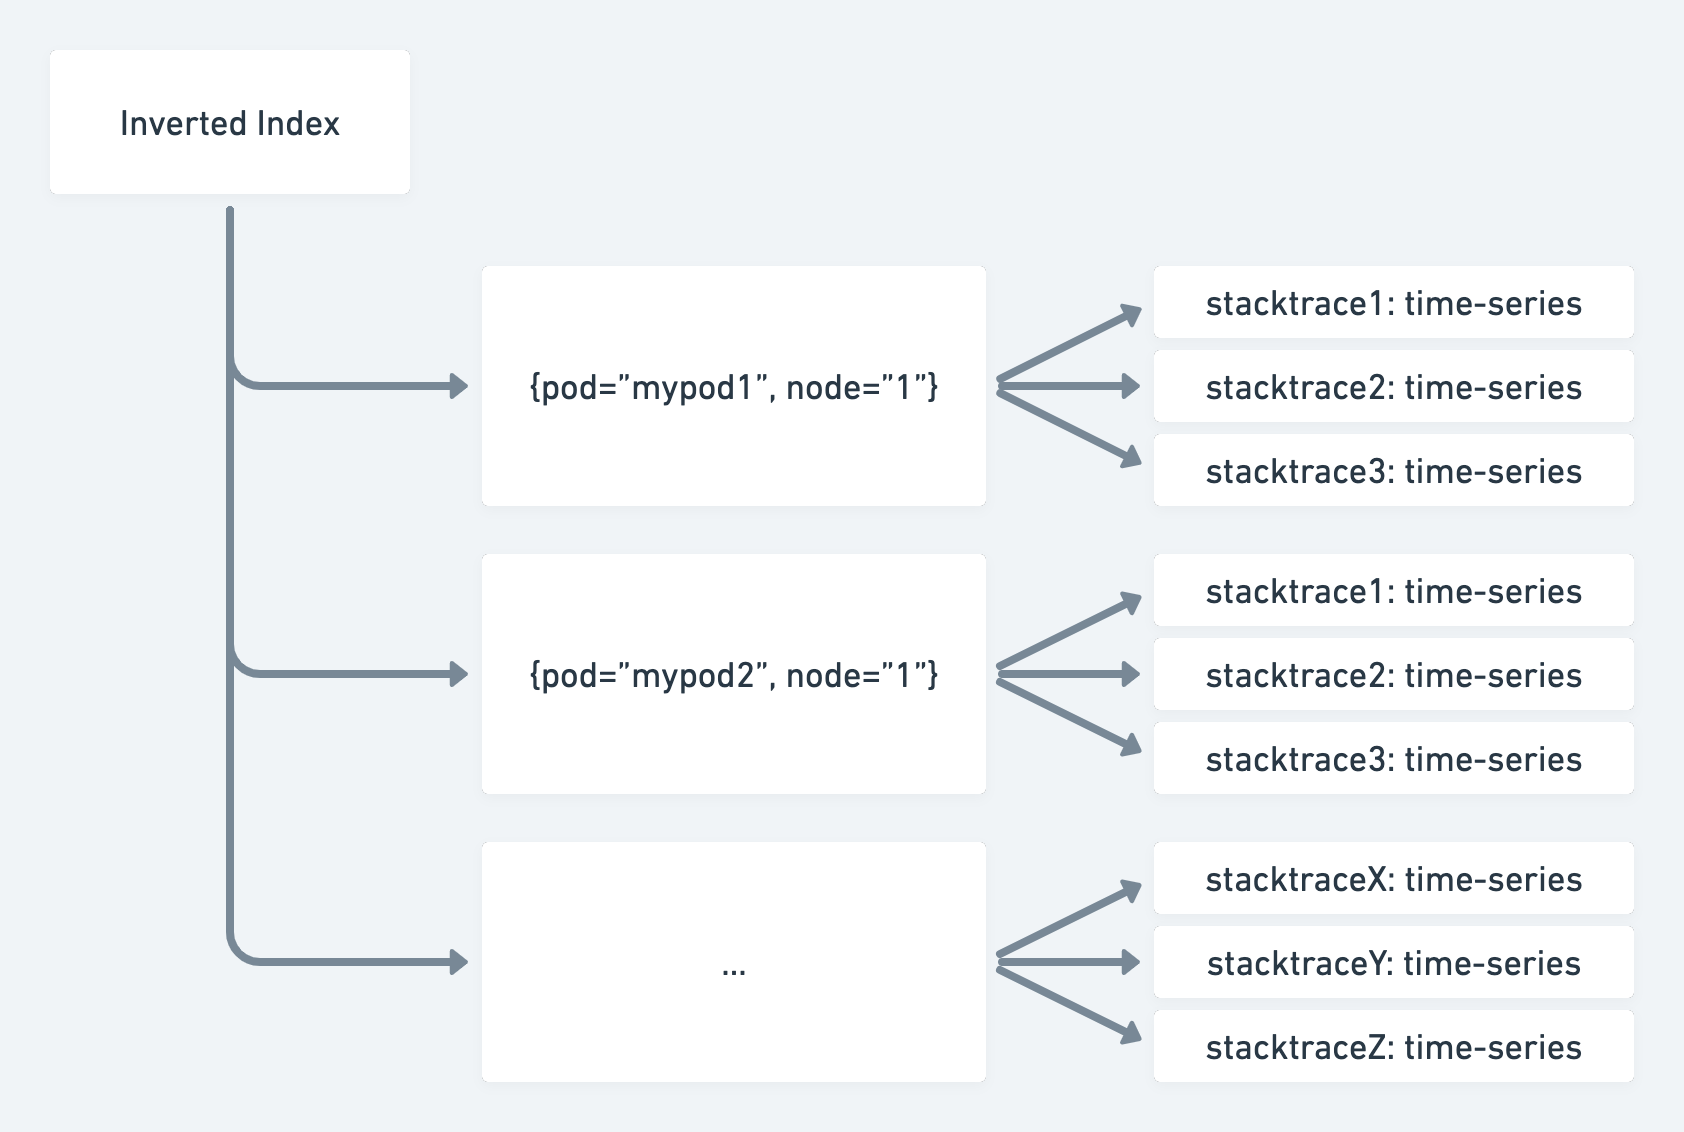
In its first iteration, the Parca storage used a Prometheus-style time-series approach for storing data, which accumulated samples per process-stacktrace combination being profiled to maximize compression using the Gorilla XOR encoding. In memory the series of process-stacktrace samples were grouped by their process ultimately making up a profile-series. When queried, the label-selector found the profile-series and then used the list of stacktraces within it to construct the result (potentially combined with many other pieces of data). To make the search happen, labels were indexed using an inverted index.
This approach worked well enough for cases where we are just querying to group by process, but we want to go further. We wanted to be able to attach arbitrary labels to stacktraces, like the pprof format allows, and be able to filter, and aggregate by those labels. This can be used for attaching labels such as customer=”X” allowing queries to understand how much CPU time is caused by a single customer. It would also allow attaching distributed tracing IDs (or span IDs) to profiling data, or vice versa attach a unique ID to each profile collected and link that ID from a distributed trace. We also want to be able to deal with short-lived environments such as CI environments or serverless, where processes are relatively short-lived. It all boils down to unbound cardinality data, which, as we learned with the Prometheus project, conflicts with the desire to buffer samples per unique series. Prometheus was not made for unbound cardinality and that's ok, but our goal was now to be abe to handle unbound cardinality, therefore the time-series style approach was no longer going to work for Parca.
We explored various optimizations to our existing database to allow for these use cases, but ultimately started to investigate alternative layouts of the data since we kept hitting roadblocks. After a few attempts a columnar layout seemed very promising as it more naturally lends itself to high cardinality data, and since all data is by definition stored by their columns, the values we intend to filter or aggregate by are already available in one place in memory or when serialized to persistent storage. These characteristics make it easy to parallelize execution of queries (using SIMD).
(If all of this sounds familiar, then that might be because you've read Honeycomb's "Why Observability Requires a Distributed Column Store", which essentially comes to the same conclusion for unbound cardinality data.)
The way we imagined the data-model to translate was that we would have a column per label, a column for stacktraces, a column for timestamps and a column for values. All data would be globally sorted by all columns so we could use binary searches to find data quickly without having to have an index per column. Early prototypes seemed so promising that we pursued this direction further.
Taking the profiling data we started with assuming it has the pod="mypod1" and node="mynode1" labels:
| labels.pod | labels.node | stacktrace | timestamp | value | | ---------- | ----------- | ---------------- | --------- | ----- | | mypod1 | mynode1 | main;func1;func2 | t1 | 2 | | mypod1 | mynode1 | main;func1;func2 | t4 | 3 | | mypod1 | mynode1 | main;func1;func3 | t1 | 23 | | mypod1 | mynode1 | main;func1;func3 | t2 | 10 | | mypod1 | mynode1 | main;func1;func3 | t3 | 12 | | mypod1 | mynode1 | main;func1;func3 | t5 | 234 |
And since each column is encoded individually, the desire was to exploit the repetitiveness of the data. Using that strategy, while logically the data is the above table, physically it can be represented much more efficiently:
| labels.pod | labels.node | stacktrace | timestamp | value | | ---------- | ----------- | -------------------- | --------- | ----- | | 6 x mypod1 | 6 x mynode1 | 2 x main;func1;func2 | t1 | 2 | | | | 4 x main;func1;func3 | t4 | 3 | | | | | t1 | 23 | | | | | t2 | 10 | | | | | t3 | 12 | | | | | t5 | 234 |
If a certain order was enforced, then for efficiency, the timestamp and value could also be encoded using the strategies laid out by the Gorilla XOR encoding.
Why build something new?
At this point you might ask yourself, “sure columnar layout sounds good, but why not use an off the shelf option?” and you’d definitely be right in asking that! There were two primary requirements that led us to build something new.
First, we needed something embeddable for Go, as we want to provide the Prometheus-like experience of a single statically linked binary that just works. This is definitely the weaker argument as there are other embeddable columnar databases, such as DuckDB that while using CGO, could have been embedded. It does however rule out external databases such as ClickHouse.
The second and more pressing argument was: in order for us to be able to translate the label-based data-model to a table-based layout, we needed the ability to create columns whenever we see a label-name for the first time. This is necessary so we have the ability to exploit the characteristics of columnar layout when searching or aggregating by label-values. If we used a map-type, which many existing columnar databases have, to represent labels we would not be able to exploit the characteristics of the columnar layout, we would essentially be loading the entire map, even when only needing to process a single key.
| labels (map) | stacktrace | timestamp | value | | ------------------------------- | ---------------- | --------- | ----- | | {pod="mypod1", node="mynode1"} | main;func1;func2 | t1 | 2 | | {pod="mypod1", node="mynode1"} | main;func1;func2 | t4 | 3 | | {pod="mypod1", node="mynode1"} | main;func1;func3 | t1 | 23 | | {pod="mypod1", node="mynode1"} | main;func1;func3 | t2 | 10 | | {pod="mypod1", node="mynode1"} | main;func1;func3 | t3 | 12 | | {pod="mypod1", node="mynode1"} | main;func1;func3 | t5 | 234 |
The only open source database that we were able to find that supports such a model was InfluxDB IOx. We talked to Paul Dix and Andrew Lamb of InfluxData, but unfortunately it was not going to be ready for us to use in time. They were very helpful though and shared a lot of their insight and learnings (the InfluxDB IOx tech talks are also fantastic and I can recommend them to anyone interested further in this topic)!
With all of this combined, we felt we had no other choice but to build something ourselves. We had been following the Apache Parquet and Apache Arrow projects out of interest for some time, and they seemed like the right technologies to build upon (and Paul and Andrew reassured us in this decision when we talked to them, as unsurprisingly InfluxIOx is based on the same technologies). And of course, thanks to building on top of Parquet and Arrow, we could focus on the things that make this database unique rather than reinventing page layouts, execution models, and so on.
Built for profiling, but can do so much more!
After about 3 months of development we now have a start of what we have started calling arcticDB. It is already very capable in handling continuous profiling data, so we wanted to start releasing it as part of the Parca project. For now it only accumulates data in-memory and when a certain size is reached it starts over. In the future this data will be persisted to object storage.
A few things that we think make arcticDB unique:
- Dynamic columns: As mentioned above, this feature dynamically creates a column whenever a sub-column is seen for the first time. In fact it actually has no effect for the table globally at insertion time, only at read time are all columns returned in their sorted order.
- Immutable and sorted: The entire database is immutable, data can only ever be written, and never modified. Additionally all data is globally sorted by columns defined in its schema. These two characteristics go hand in hand, we can only maintain global sorting at low cost if data cannot be modified (as it could affect sorting, requiring a re-sort). Sorting allows for efficient searches without an extra index, and immutability is typical for Observability workloads, so it's not a downside for the applications.
- Consistency trade-offs: arcticDB has a weak consistency model, it does not have read-after-write consistency as the intended use for it is in systems where the user querying data is distinct from the entity writing data, typically machines, not humans, meaning that the entity writing data is not the same as the entity reading it, so read-after-write consistency is not necessary. That said, writers can still simulate read-after-write consistency by waiting and watching if their transaction successfully advances or not.
If you want to find out about these mechanisms in more detail refer to the arcticDB README.
Acknowledgements
Shout out to Tyler Neely for spending hours with me discussing write isolation mechanisms we could use. This discussion ultimately led to the batch-based write isolation we ended up implementing! Also, shout out to Paul Dix and Andrew Lamb of InfluxData for letting us bounce early ideas and share their experience with InfluxIOx! Also a massive shout out to the folks at Segment (and especially Achille Roussel) for recently opening their Parquet library for Go, which has been a bliss to work with! And last but not least, shout out to Julien Pivotto of the Prometheus team for trialing Parca with arcticDB extensively and reporting high quality bugs (while using it to fix a memory leak in Prometheus!), which after fixing we were comfortable making this announcement and release arcticDB as part of Parca!
What’s next?
This is only the very beginning of arcticDB, there are still lots of features that have not been implemented but we wanted to share it early and start to make real use of it in Parca! This blog post also only touches on high level topics regarding arcticDB, there are many parts of it that deserve their own blog posts.
We would very much appreciate if you could give it a spin by grabbing the latest Parca release and try it out!
If you’re at KubeCon EU 2022, come say hi at our Polar Signals booth at SU8!
We are hiring!
If arcticDB sounds interesting to you, and you would like to work on and influence the future direction of the database, we just opened a position for a database engineer!