Continuous profiling is the act of taking snapshots of your application at intervals, and then using those snapshots to be able to ask questions about how your program is behaving. Questions such as, where is all my memory being used? Where is my program spending its CPU time? The answers to these questions allow you as a developer to optimize your applications to be more efficient, reliable and ultimately save costs and headaches.
In this blog post we’ll cover a recent real world example of how we used continuous profiling to discover and optimize a program.
Parca is an open source continuous profiling application. The backing storage layer for Parca is called FrostDB. Recently persistent storage was added to FrostDB to allow the in memory data to be stored on disk or in a compatible object storage to be retrieved later if needed. This is the first step in an important feature to better facilitate queries of your infrastructure over time. However, when we at Polar Signals were running with this new persistence feature enabled we noticed something peculiar.
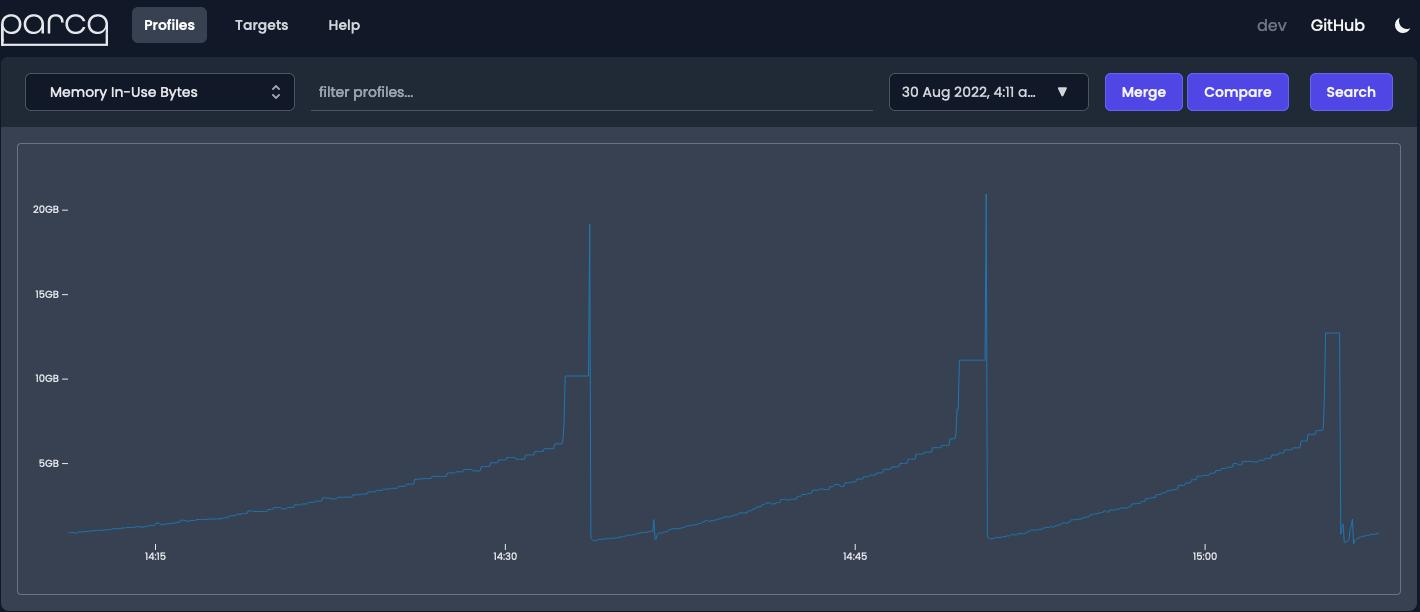
When FrostDB would go to write out to storage, we’d see a huge spike in memory. Behavior like this can cause serious headaches when you’re on call. For example, under high memory pressure critical workflows might get OOM killed by the kernel, and reducing unnecessary memory consumption can improve the overall health of the system by increasing available memory for critical applications. Continuous profiling gives us the ability to quickly correlate changes made to code or deployments with the specific functions that are causing problems. If you don’t have continuous profiling you’d have to start guessing as to where the memory spikes are coming from, and typically spend a considerable amount of time and resources debugging that problem. For example if we’re taking a look at the code that writes out blocks to storage we might see an obvious culprit of all this memory bloat.
buf := bytes.NewBuffer(nil)cols := merged.DynamicColumns()w, err := t.table.config.schema.GetWriter(buf, cols)if err != nil {return nil, err}
We create a buffer, and a writer that’s going to write all of the in-memory profiles into that buffer. However, it turns out that this isn’t where all of our memory is going. This is where continuous profiling really demonstrates its value. We can look at one of the profiles during the memory spike to help us discover what exactly is happening during those memory spikes.
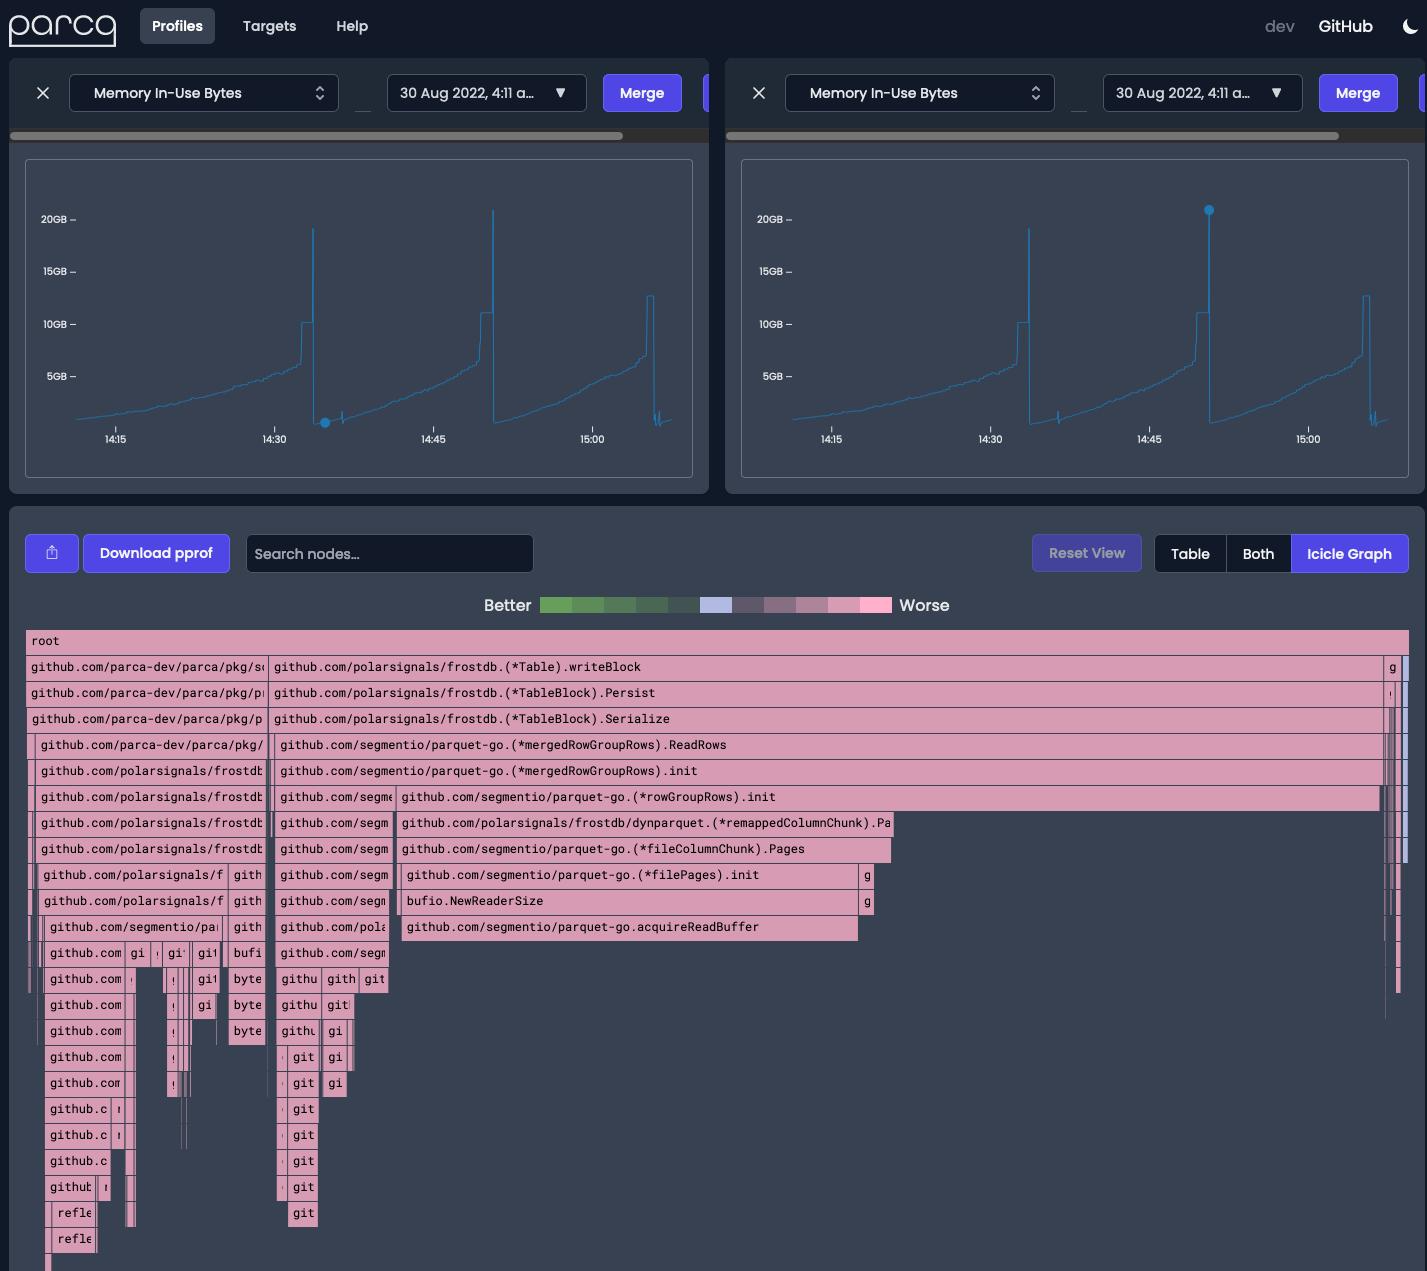
As you can see in the in-use memory profile that we’ve uploaded to pprof.me we can quickly see that the `ReadRows` function is actually responsible for a majority share of memory being utilized. So if we refactor the code to instead submit sub slices of the dynamic row groups to the ReadRows function we see our memory spikes disappear during persistence writes. Pull request to address the memory spikes
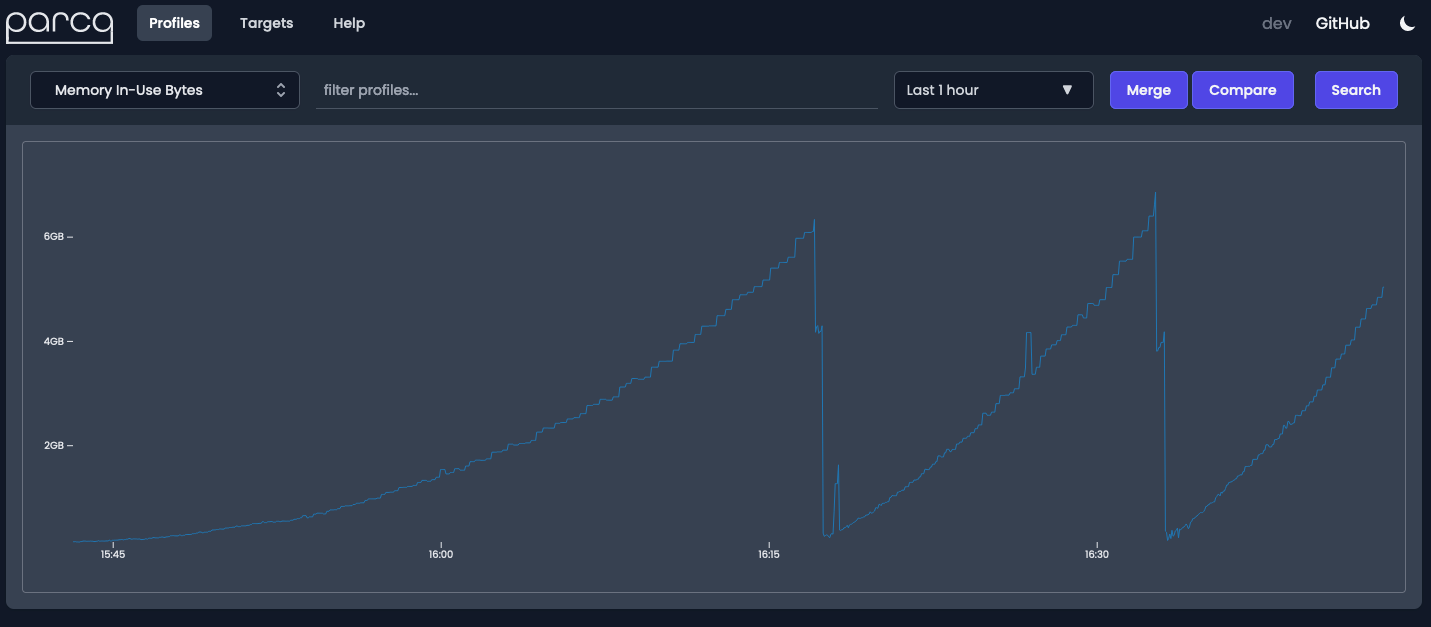
Using continuous profiling we were able to invalidate our bad assumptions and quickly answer the question of where is all the memory being used? Leading to the stopping of oom kills, and a more stable and reliable service. Parca is free and open source; you can try it out yourself at parca.dev