Polar Signals is happy to attend KubeCon NA 2022 in Detroit, USA. As long-time maintainers of Kubernetes, Prometheus, and Thanos we are looking forward to finally meeting the cloud-native community in the US again!
Throughout the week of KubeCon from October 24th to 28th, you can reach out to Frederic, Matthias, and Kemal on Twitter or CNCF Slack. Let's meet!
Talks
Polar Signals employees are giving talks at KubeCon and Prometheus Day.
- Prometheus Day: Tuesday, October 25th, 11:05 - 11:35:
Achieving Zero-Instrumentation Monitoring with eBPF
Kemal Akkoyun, Polar Signals - KubeCon: Friday, October 28th, 11:55 - 12:30:
SLO-Based Observability For All Kubernetes Cluster Components
Matthias Loibl, Polar Signals & Nadine Vehling, Grafana Labs
Products
Leading up to this KubeCon we've been busy adding new features and products. Here is an overview.
Parca
Last week Parca v0.13.0 was released. It comes packed with amazing new features such as, Parca Agents being shown on the targets page, an all new and experimental callgraph visualization, snap packages, and tons of updates with fixes and improvements to FrostDB.
Parca Plugin for Grafana
Last week Polar Signals released a Parca plugin for Grafana! With this plugin you can now visualize icicle graphs right from your Grafana dashboards. Check out this amazing correlation from Manoj, who also lead the development of this plugin!
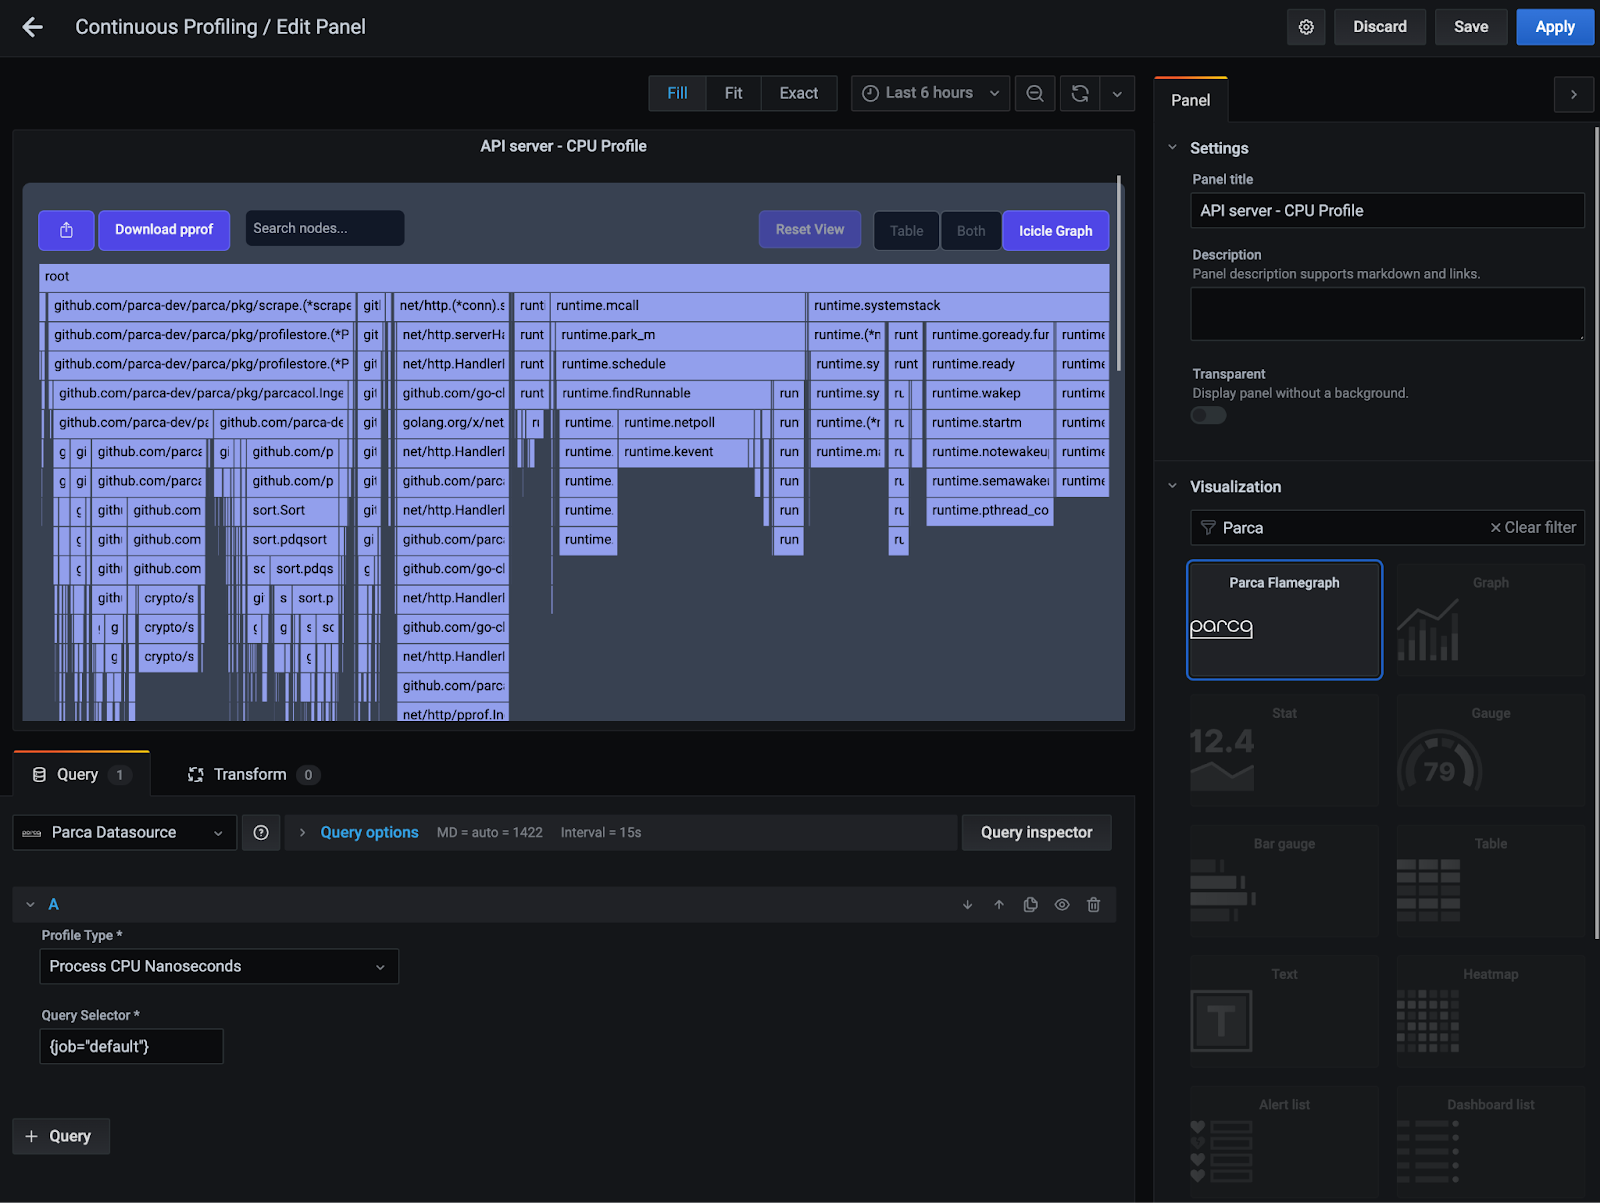
A screenshot of Parca flame-graph panel configuration
Parca Agent
We'll be shorty releasing a new version of our Agent, which adds many exciting features and improvements thanks to a major rearchitecture we've been working on:
- A new metadata system to augment the profiles with tags that can help you slice and dice profiles and help troubleshoot performance issues faster!
- We've been working on efficiency and reduced its resource usage.
- System-wide profiling, which allows to see profiles for every running proccess. We wrote about this feature and what it entailed to implement it in our blog.
- And many, many correctness fixes, which will help generate more accurate profiles.
All new pprof.me
In short, pprof.me now has all the features that are available in Parca's visualization component, but here's a summary:
- Interactive visualization types: Flamegraph and Top table. Soon to come are the other visualization types like the Callgraph.
- Search and filter nodes for specific function names.
- Quick snapshot (Function name, File, Line number, Build ID, etc.) on hovering a node.
- Ability to download the profile in pprof format.
- And finally, dark mode UI!
Let's get in touch!
Feel free to reach out to Frederic, Matthias, and Kemal on Twitter or CNCF Slack and we can meet!
See you in Detroit!