This feature was previously introduced in the announcement post.
Sampling CPU profilers periodically fetch the stacks of the profiled processes that are running on the CPU at a given time. Walking the stacks of native processes, such as the ones written in C, C++, Rust, etc. can be a bit more complicated than one might expect. Most of the complexity is due to the lack of frame pointers, which is quite common.
We have developed an improved stack walker that works even if frame pointers are omitted in the Parca continuous profiling project's Agent.
The stack in x86_64
The x86_64 architecture, besides describing its instruction set and several other important characteristics, also defines the rules on how data should be laid out in its Application Binary Interface or ABI for short. The specification shows how the stack should be set up for this architecture.
When this code is executed, the different `call` instructions will push the return address to the stack. Once a function returns, the CPU will read the return address and jump to it, continuing where the callsite of the function left.
With no additional information, it’s not possible to reliably produce a stacktrace. There could be other values, such as function local data, that are stored in the stack that might look like function addresses. This is what frame pointers aim to solve.
Can I have a (frame) pointer?
For the following pseudocode, assuming no compiler optimisations:
int top(void) {for(;;) { }}int c1(void) {top();}int b1(void) {c1();}int a1(void) {b1();}int main(void) {a1();}
To walk the stack with this method, we need to keep a pointer to the previous frame. In the x86 architecture, this typically would be in the frame pointer, `$rbp`. As functions may call other functions, this register has to be stored on function entry and restored on function exit.
This is accomplished by the so-called function prologue, on function entry, which might look like this
push $rbp # saves the stack frame pointer
mov $rbp, $rsp # sets the current stack pointer to the frame pointer
The function epilogue on the function returns
pop $rbp # restores the function's frame pointer
ret # pops the saved return address and jumps to it
If we compile and run the C code above with frame pointers, the stack would have all the necessary information to walk the stack. Calling the different functions effectively creates a linked list that we need to traverse.
Disassembly of the code above compiled with frame pointers
# compiled with `gcc sample.c -o sample_with_frame_pointers -fno-omit-frame-pointer`
$ objdump -d ./sample_with_frame_pointers
0000000000401106 <top>:
  401106:       55                      push   %rbp
  401107:       48 89 e5                mov    %rsp,%rbp
  40110a:       eb fe                   jmp    40110a <top+0x4>

000000000040110c <c1>:
  40110c:       55                      push   %rbp
  40110d:       48 89 e5                mov    %rsp,%rbp
  401110:       e8 f1 ff ff ff          call   401106 <top>
  401115:       90                      nop
  401116:       5d                      pop    %rbp
  401117:       c3                      ret

0000000000401118 <b1>:
  401118:       55                      push   %rbp
  401119:       48 89 e5                mov    %rsp,%rbp
  40111c:       e8 eb ff ff ff          call   40110c <c1>
  401121:       90                      nop
  401122:       5d                      pop    %rbp
  401123:       c3                      ret

0000000000401124 <a1>:
  401124:       55                      push   %rbp
  401125:       48 89 e5                mov    %rsp,%rbp
  401128:       e8 eb ff ff ff          call   401118 <b1>
  40112d:       90                      nop
  40112e:       5d                      pop    %rbp
  40112f:       c3                      ret

0000000000401130 <main>:
  401130:       55                      push   %rbp
  401131:       48 89 e5                mov    %rsp,%rbp
  401134:       e8 eb ff ff ff          call   401124 <a1>
  401139:       b8 00 00 00 00          mov    $0x0,%eax
  40113e:       5d                      pop    %rbp
  40113f:       c3                      ret
```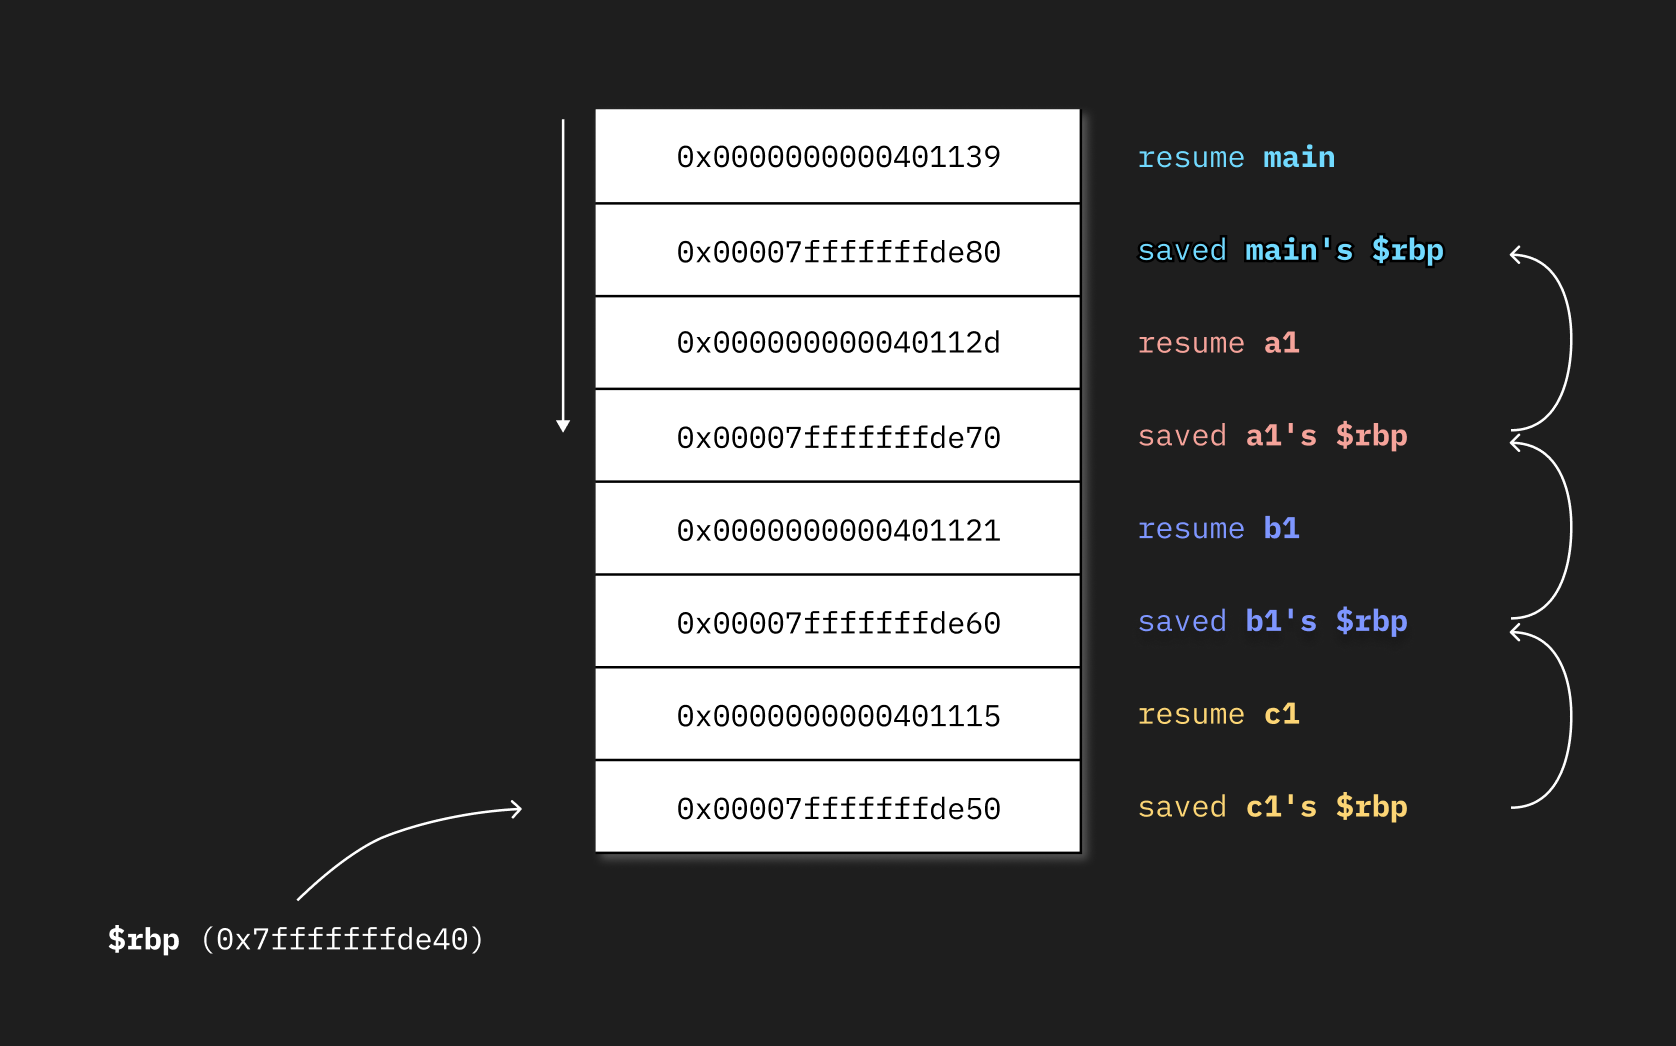
The contents of the native stack in the example code above are compiled with frame pointers when the top function is running.
To walk the stack, we would have to follow the generated linked list above, reading the values pushed before each saved `$rbp`, which will make our stack frames, until `$rbp` is zero, which indicates that we've reached the end of the stack.
This is nice because it allows us to figure out the stack trace cheaply. It’s also relatively easy for compiler implementers to add, and in general, requires a reasonably small amount of surrounding infrastructure to make it work.
Despite all the advantages, a lot of the code that we rely on is not compiled with frame pointers. Many of us rely on our Linux distribution applications and libraries, and the overwhelming majority of them choose to omit frame pointers. Even if you compile your code with frame pointers, dynamically or statically linking any library provided by your distribution might prevent you from being able to correctly unwind the stack using frame pointers alone.
We won’t dive into the reasons why frame pointers are disabled in some environments and the nuances around them, but we believe that benchmarking their overhead has to be done on an application-by-application basis. The often-overlooked costs that come with disabling frame pointers should also be considered.
The disassemble of this executable compiled without frame pointers
# compiled with `gcc sample.c -o sample_without_frame_pointers -fomit-frame-pointer`
$ objdump -d ./sample_without_frame_pointers
[...]
0000000000401106 <top>:
  401106:       eb fe                   jmp    401106 <top>

0000000000401108 <c1>:
  401108:       e8 f9 ff ff ff          call   401106 <top>
  40110d:       90                      nop
  40110e:       c3                      ret

000000000040110f <b1>:
  40110f:       e8 f4 ff ff ff          call   401108 <c1>
  401114:       90                      nop
  401115:       c3                      ret

0000000000401116 <a1>:
  401116:       e8 f4 ff ff ff          call   40110f <b1>
  40111b:       90                      nop
  40111c:       c3                      ret

000000000040111d <main>:
  40111d:       e8 f4 ff ff ff          call   401116 <a1>
  401122:       b8 00 00 00 00          mov    $0x0,%eax
  401127:       c3                      ret
[...]
Diff between the two disassembles
top:
-       push   %rbp
-       mov    %rsp,%rbp
        jmp    40110a <top+0x4>

c1:
-       push   %rbp
-       mov    %rsp,%rbp
        call   401106 <top>
        nop
-       pop    %rbp
        ret

b1:
-       push   %rbp
-       mov    %rsp,%rbp
        call   40110c <c1>
        nop
-       pop    %rbp
        ret

a1:
-       push   %rbp
-       mov    %rsp,%rbp
        call   401118 <b1>
        nop
-       pop    %rbp
        ret

main:
-       push   %rbp
-       mov    %rsp,%rbp
        call   401124 <a1>
        mov    $0x0,%eax
-       pop    %rbp
        ret
If when we are profiling we are somewhere in the execution of c1, the stack might look like this:
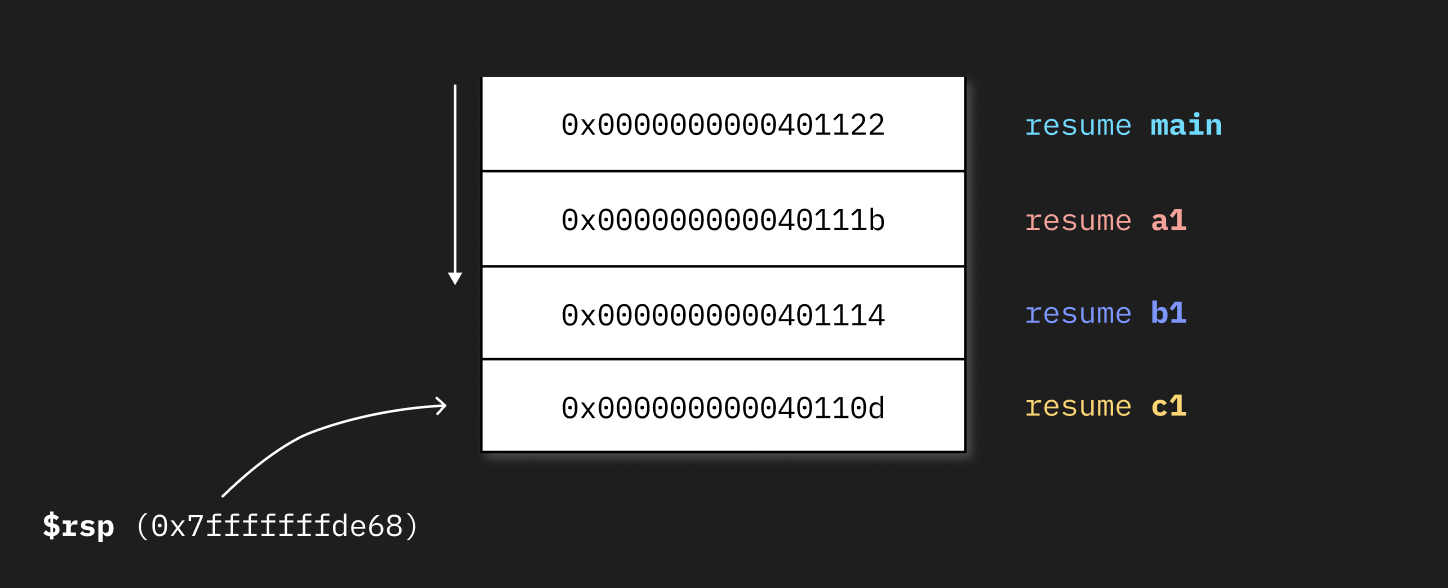
The contents of the native stack from the code above when top is running.
We need some other information or hardware support to be able to reliably unwind the stack.
Hardware approaches
There are some hardware facilities that we could use for stack unwinding, such as Intel’s Last Branch Record (LBR). LBR produces pairs of origin and destination addresses, `FROM_IP` and `TO_IP`, that we can use to build stack traces. One drawback they have is that the depth of the records they can produce is limited. Depending on the processor this could be around 32 last taken branches.
While LBR is versatile and powerful, we decided to not use it for CPU profiling as this feature is not available in every virtualized environment and it’s Intel-specific. These drawbacks extend to other interesting vendor-specific processor features, such as Intel Processor Trace (PT).
An exceptional encounter
Some of you might be thinking, how is it possible that I can compile, let’s say, C++ applications without frame pointers, and exceptions still work just fine? What about Rust, where frame pointers are disabled by default but invoking `panic()`s shows a full and correct stack trace?
For C++ exceptions to work no matter how the binaries are compiled, as well as to add some other necessary facilities to make them function, compilers can emit some metadata that indicated how to unwind the stack. This information provides a mapping of program counters to the instructions on how to restore all the registers.
All this is described in two documents, the DWARF debugging information format and the x86_64 ABI.
DWARF’s Call Frame Information (CFI)
The main goal of the Call Frame Information is to provide answers on how to restore every register for the previous frame at any part of our code execution. Directly storing a table that contained each program counter and all the registers and their location, such as whether they’ve been pushed to the stack or not, would generate humongous unwind tables.
For this reason, this format attempts to be compact and only contain the information that is needed. It uses various techniques to this effect such as:
- Variable length compression of numbers with LEB128.
- Data compression with a state machine. This is important as it allows for a very succinct representation of the data at the expense of increased complexity.
The unwind tables are encoded in the CFI format in the form of opcodes that we need to evaluate. There are two main "layers" to it. The first one is a state machine encoded in a VM. This helps with repetitive patterns that compress well and allows for a more compact representation of some data, as in some cases there’s a specialized opcode that consumes 1, 2, or 4 bytes, rather than using 4 bytes all the time. Registers that aren’t pushed into the stack might not appear in the table.
What I call the second level, is a special opcode that contains another set of opcodes, containing arbitrary expressions, that we need to evaluate. The main difference between these two levels is that while for the first level, we just need a stack to remember and restore registers (`DW_CFA_remember_state` and `DW_CFA_restore_state`, respectively), for the second level we need to evaluate arbitrary Turing complete expressions. For this reason, we need a full-blown VM to evaluate any expression.
Implementing a VM in BPF is not very practical, so we decided to take a pragmatic approach and start by hardcoding the 2 expressions that happen more than 50% of the time in most binaries we've evaluated. We have some ideas on how to further improve expression support, but this blog post is getting way too long already :).
Walking the stack using DWARF’s CFI
To use this approach to walk the stack for a given Program Counter (PC), we need to find its corresponding unwind information. But what do we mean by the unwind information, exactly?
We need to restore:
- The saved return address.
- The values for the stack pointer ($rsp) and frame pointer ($rbp) registers in the previous frame are used to restore the previous frame’s stack pointer.
The value of the stack pointer for the previous frame, just before our current function got called, in DWARF’s CFI terms, is called the Canonical Frame Address or CFA. As we saw before, in x86_64, the saved return address is always 8 bytes (a word) ahead of the CFA.
The unwinding algorithm looks something like this:
- Read the initial registers
- The instruction pointer `$rip`. Needed to find the row in the unwind table.
- The stack pointer `$rsp`, and the frame pointer `$rbp`, which are needed to calculate the the previous frame's stack pointer value (CFA). We can find the return address and other registers pushed on the stack at an offset from CFA.
- While `unwind_frame_count <= MAX_STACK_DEPTH`:
- Find the unwind table row for the PC for which i satisfies that `$unwind_table[i].PC <= $target_PC <= $unwind_table[i+1].PC`.
- If there's no entry for it and `$rbp` is zero, we have reached the bottom of the stack.
- Add instruction pointer to the stack.
- Calculate the previous frame's stack pointer. This can be based on the current frame's `$rsp` or `$rbp`, if it's not an expression or register directly.
- Updates the registers with the calculated values for the previous frame.
- Continue with the next frame. Go to 2.
- Find the unwind table row for the PC for which i satisfies that `$unwind_table[i].PC <= $target_PC <= $unwind_table[i+1].PC`.
Note: for simplicity, we are omitting some important details that our unwinder implements.
To do this, we need to read the unwind opcodes, evaluate them, and generate the tables. This process can be quite expensive, but it’s how it’s done by the exception handling infrastructure in C++, among others. Because exceptions are supposed to be, erm, exceptional, these code paths should not be exercised often and the overhead won’t be too high.
This is also the case for debuggers, such as GDB, where users might want to know the stack trace here and there to understand where they are in the execution. These use cases are sometimes categorised under offline unwinding.
Profilers are a bit different in that they usually sample the stack dozens or hundreds of times a second. The overhead of having to read, parse, and evaluate the unwind information can be quite high. While stack unwinders might do some caching, the whole process is still quite expensive.
A key observation in our case is that we don’t need to restore every register, we only need these 2 and the saved return address. This insight allows us to produce a representation that works better for our online unwinding use case.
Possible implementations
The profiler we’ve developed isn’t by far the first one to use this technique. Perf, the venerable Linux profiler has supported DWARF-based stack unwinding for a while. By leveraging `PERF_SAMPLE_REGS_USER` and `PERF_SAMPLE_STACK_USER` introduced in the perf_event_open system call in Linux 3.4, it can receive the registers for the profiled processes as well as a copy of the stack for every sample.
While this approach has been proven to work, and we evaluated implementing our profiler in a similar fashion, it has a few drawbacks we wanted to avoid:
- Performance: the kernel copies the user stack for every sample. It copies the user stack that’s currently in use, but this can be quite a bit of data. Assuming a very conservative `1K per stack * 100 samples/second * 30% of the time running on CPU * 10 CPUs` = 300KB per second.
- Security: the implications of having another process having the values of another process’s stack can be complicated. What if some private key or any sort of Personally Identifiable Information (PII) is present there?
While 300KB/s doesn’t seem like a lot of data, we believe that this number can be significantly higher for busy machines running CPU-intensive applications. We hope that by reducing the impact of the measurements while the profiler is running, fewer resources will be dedicated to the profiler that otherwise applications could use.
Another idea that popped into our heads was to perhaps copy the stack in a BPF program, but this would still have the disadvantages we wanted to avoid, and we would have to reimplement the functionality that the kernel already has and that it’s proved to work very well!
This brings us to the approach we eventually took, still leveraging BPF!
Why BPF?
We are big believers in BPF. There are many reasons for this. Broadly, it allows for the Linux kernel to be programmable with higher safety guarantees and a lower barrier of entry.
Developing profilers in BPF makes a lot of sense as once the stack walking mechanism is implemented, we can leverage the perf subsystem to get samples on CPU cycles, instructions, L3 cache misses, or any other performance counter that’s available in our machine. It also helps develop other tools, such as allocation tracers, off-CPU profilers, and many many others.
You might be wondering, why all this talking about stack unwinding in BPF? With the `bpf_get_stackid(ctx, &map, BPF_F_USER_STACK)` helper we can fetch user stacks! Turns out, this helper walks the stack using frame pointers, and a fully featured DWARF unwinder is unlikely to ever land in the kernel.
A BPF-friendly representation of the unwind table
Most offline stack unwinders don’t process most of the DWARF CFI information as they target very few program counters. Profilers, on the other hand, might yield a higher cardinality of program counters. For this reason, and the fact that we only need a subset of the data to walk the stack, as we don’t require to know how to restore every single register, as well as to produce some representation that minimises the work that the BPF unwinder has to do, we decided to take on the unwind table generation cost upfront.
In userspace, we first parse, evaluate, and generate unwind tables. So far, we only support information stored in the `.eh_frame` ELF section. The generated table is a couple of arrays built up from this row type:
typedef struct {u64 pc;u16 _reserved_do_not_use;u8 cfa_type;u8 rbp_type;s16 cfa_offset;s16 rbp_offset;} stack_unwind_row_t;
We use a whole word for the program counter and then have a couple of fields that help us calculate CFA. For example, it can be at an offset from either the current `$rsp` or `$rbp`. We also find out how to restore $rbp.
Using the algorithm described above, we walk through the frames, by restoring the previous frame's registers. The table is sorted by program counter, to be able to binary search over the table in the BPF program.
We are done walking the stack iff we can’t find unwind information for a given PC and the current `$rbp` is zero. We then aggregate the stacks in a BPF map, in kernel space, to maximise efficiency, and we collect this data twice a minute from userspace, where we generate the profiles and send them to a Parca Server compatible server.
The development
Early on when we started this project we realised that there were many variables that could affect its success. To the best of our knowledge, there’s no other feature complete, open source, dwarf-based BPF unwinder, so we weren’t sure of how viable it would be. Hence, to maximise our chances of success, we tried to significantly reduce the problem space, while still giving us as much signal as possible.
At Polar Signals, we create a Request For Comments (RFC) for every large feature or topic we want to discuss or get feedback on. For this work, we started with a document laying out what we wanted to achieve for the first iteration, including goals and even more importantly, the non-goals.
After some weeks of work, we landed the first version, which focused on correctness. We continued with follow-ups to loosen the minimum kernel requirements (kernel ~4.10), as well as to make the unwind table rows more compact.
Building this in BPF was an interesting challenge. The kernel has to ensure that any loaded program can’t make it crash. It statically analyses code using the verifier, which will either reject or accept a program. Some of the current rules as of the writing of this post are, no dynamic allocations, termination has to be provable, and many others, so we had to get creative to get the verifier to accept our program. This write-up is getting way too long so this would be a story for another time :)
Testing
For the unwinder to work, both the unwind table and the unwind algorithm implemented in BPF have to work well. Ensuring that the tables were correct was paramount in the development of this project.
In this case, we decided early on to use snapshot testing in a very simple form. We have some test binaries as well as the expected unwind table in a separate git repository. As part of our testing suite in the Agent, we regenerate the tables and ensure that there aren’t any changes.
This technique allowed us to quickly iterate on the DWARF unwind information parser, helping us find a myriad of bugs, and saving us a lot of time we would have spent otherwise trying to understand why we failed at walking the stack.
Future work
There are lots of features and fixes we are working on, and we are excited to be sharing them with you very soon!
We’ve only released the first version that includes dwarf-based stack unwinding a few days ago. But we already have some more changes to ensure that the profiler runs well in memory-constrained machines, improved architecture, enabling better support for JIT’ed code, among others.
Near term, we are shifting our focus towards reliability, performance, and wider support. The parsing, evaluation, and handling of DWARF’s unwind information is not optimised yet. We also want to ensure that we have detailed performance metrics for our profiler. Finally, we want to do more exhaustive testing for tables produced by Clang and the Rust compiler toolchains.
The ultimate goal of this project is to enable this profiler by default to all of our users, without incurring a significantly higher resource usage.
Give it a try!
̶A̶s̶ ̶m̶e̶n̶t̶i̶o̶n̶e̶d̶ ̶a̶b̶o̶v̶e̶,̶ ̶t̶h̶i̶s̶ ̶n̶e̶w̶ ̶f̶e̶a̶t̶u̶r̶e̶ ̶i̶s̶ ̶b̶e̶h̶i̶n̶d̶ ̶a̶ ̶f̶e̶a̶t̶u̶r̶e̶ ̶f̶l̶a̶g̶,̶ ̶b̶u̶t̶ ̶w̶e̶ ̶a̶r̶e̶ ̶g̶o̶i̶n̶g̶ ̶t̶o̶ ̶e̶n̶a̶b̶l̶e̶ ̶i̶t̶ ̶b̶y̶ ̶d̶e̶f̶a̶u̶l̶t̶ ̶i̶n̶ ̶t̶h̶e̶ ̶n̶e̶x̶t̶ ̶v̶e̶r̶s̶i̶o̶n̶ ̶o̶n̶c̶e̶ ̶w̶e̶ ̶l̶a̶n̶d̶ ̶s̶o̶m̶e̶ ̶i̶m̶p̶r̶o̶v̶e̶m̶e̶n̶t̶s̶ ̶w̶e̶ ̶a̶r̶e̶ ̶w̶o̶r̶k̶i̶n̶g̶ ̶o̶n̶.̶
This feature is now enabled by default and has been running in production for a long time as of January 2024. You can download the latest release here.
Working with the community
We believe that the pervasive lack of frame pointers is a big issue for application developers, as well as developers of profilers, debuggers, and compilers.
Fortunately, this problem space is being actively worked on by many members of the wider engineering community, such as this proposal to enable frame pointers by default in Fedora, or the .ctf_frame work, an alternative format to dwarf unwinding that’s specifically tailored to the online, asynchronous (meaning that can unwind any program counter, not just from specific parts) use-case that profilers and other tools need.
Open source and collaborating with other communities are a big part of our company ethos. That's why we started speaking about this project early on, starting with a Linux Plumbers talk last September, where we announced this work.
Our unwinder is licensed under the GPL license. It's open for inspection and contributions, and we would love to work with other projects facing similar issues. Don’t hesitate to reach out! Let us know if there’s any feedback or features that you would like to see implemented, either in our Discord or in the GitHub discussion.
Acknowledgments
This work wouldn’t have been possible without the work of many individuals. There’s a lot of infrastructure that had to be in place for this project to be possible at all.
- The Delve debugger for Go, which our DWARF unwind information parser is based on.
- Ian Lance Taylor’s blog series on .eh_frame.
- MaskRay’s blog is packed with interesting compilers and linkers content.
- The engineers involved in both the DWARF standards and different ABIs. Coming up with something so flexible is not easy. The open and detailed specs are a great resource.
- Compiler engineers are the unsung heroes of this work. Creating unwind tables isn’t easy. Maintaining them in sync across compiler passes is a herculean task.
- Without BPF and its surrounding ecosystem, we wouldn’t have a safe way to create programmable system-wide profilers. While sometimes the verifier can be tough, it’s our best ally.
- The Reliable and fast DWARF-based stack unwinding paper provides a superb description of all the systems we described in this post, as well as trying some different non-BPF approaches to speed up dwarf-based unwinders, and some of the correctness testing they carried that found several bugs. We owe them not just increasing the quality of unwinding tables that many systems, including ours, depend on, but also helping raise awareness of all these systems and how critical they are.
Notes and ramblings
- While the term "stack walking" is more correct in the context of profilers, and "stack unwinding" is typically used when the runtime is handling exceptions, we use these two terms interchangeably.
- Our table format uses the smallest datatypes we could use, which set some limits on the minimum and maximum value for offsets, among others. You can check them out in this design document, which also includes some of the requirements for this unwinder. We are already working on removing some of the mentioned limitations!
- A very interesting idea from the "Reliable and fast DWARF-based stack unwinding" paper is to synthesise unwind tables from object code when unwind tables are not present or complete for some reason. This is something we might entertain in the future.
- To add some insights into the complexity implications, just in terms of code size, the previous frame pointer-based unwinder could be re-implemented in BPF in less than 50 lines, while this dwarf-based one is more than 500 lines. This excludes all the necessary supporting code in userspace and tests.
- Last but not least, don't take this work as an apology for frame pointer removal! If we could change something technical and low-level in the computing industry, it would probably be enabling frame pointers by default. This is something that hyperscalers, such as Facebook and Google already do, despite the potential extra compute costs, as they save them headaches and time when every minute of troubleshooting an incident is costing lots of money. That being said, we understand that even if everybody would agree to enable frame pointers, it would take years until all of our users would reap the benefits.
Side note: the C++ exception machinery is quite complex and has to do quite a bit of work as described in this write-up. Some interesting things to think about: what would be the cost when the unwind tables are in memory vs when they are not? Could this be a problem with your application? How are these paths exercised?
Further Reading
In other words, articles we wished we had at the beginning of our journey.