We've been working hard to get the Parca Agent eBPF-based DWARF stack unwinder to be generally available and enabled by default. Among other things, we've been extensively profiling postgres on Fedora when we realized that some (not all!) function's memory addresses were not being symbolized successfully.
When I started to investigate this I started with the obvious questions: Where did the debuginfo come from? Was it reliable? Could we get better debuginfos?
Because this is a standard postgres, installed from Fedora packages, I can conveniently retrieve debuginfos from publicly available packages using their publicly accessible debuginfod server. To troubleshoot further I downloaded the debuginfos that were seemingly not working correctly.
curl https://debuginfod.fedoraproject.org/buildid/fc8e3f5bdf24747246833b88be016056e1c742c4/debuginfo > postgres-debuginfo
The `debuginfod` protocol is pretty simple, once you have an endpoint that you know serves the `debuginfod` API you can request `/buildid/<buildid>/debuginfo` and you have a URL to download debuginfos. The above is exactly the command we used to troubleshoot this.
A primer on symbolization using DWARF
Before I start digging further into the problem, let's start with a quick primer on symbolization using DWARF. If you're already intimately familiar with it, you can skip to the next section of the post.
The way symbolization works in the first place is through sections in ELF binaries generally referred to as "debuginfo", most commonly in the DWARF format. DWARF is a complex format, its flexibility goes to the point where DWARF entries can even be instructions, working on registers, even making it Turing complete. Luckily when dealing with symbolization we had not encountered very complex scenario's (yet)!
Let's look at example DWARF of a tiny C program.
#include <stdio.h>
int main() {
   printf("Hello, World!");
   return 0;
}
Compile it, enabling DWARF to be emitted (`-g`):
zig cc -o mainc -g -target x86_64-linux main.cNote: Any C compiler could have been used here but I'm on OSX and Zig's cross-compile support is very convenient.
And let's use the `dwarfdump` tool to print everything.
$ dwarfdump --show-form mainc
mainc:  file format elf64-x86-64

.debug_info contents:
0x00000000: Compile Unit: length = 0x00000047, format = DWARF32, version = 0x0004, abbr_offset = 0x0000, addr_size = 0x08 (next unit at 0x0000004b)

0x0000000b: DW_TAG_compile_unit
              DW_AT_producer [DW_FORM_strp]     ("Homebrew clang version 13.0.1")
              DW_AT_language [DW_FORM_data2]    (DW_LANG_C99)
              DW_AT_name [DW_FORM_strp] ("main.c")
              DW_AT_stmt_list [DW_FORM_sec_offset]      (0x00000000)
              DW_AT_comp_dir [DW_FORM_strp]     ("/Users/brancz/src/github.com/polarsignals/polarsignals/pkg/debuginfo/objfile/testdata")
              DW_AT_low_pc [DW_FORM_addr]       (0x0000000000201e20)
              DW_AT_high_pc [DW_FORM_data4]     (0x00000016)

0x0000002a:   DW_TAG_subprogram
                DW_AT_low_pc [DW_FORM_addr]     (0x0000000000201e20)
                DW_AT_high_pc [DW_FORM_data4]   (0x00000016)
                DW_AT_frame_base [DW_FORM_exprloc]      (DW_OP_reg6 RBP)
                DW_AT_GNU_all_call_sites [DW_FORM_flag_present] (true)
                DW_AT_name [DW_FORM_strp]       ("main")
                DW_AT_decl_file [DW_FORM_data1] ("/Users/brancz/src/github.com/polarsignals/polarsignals/pkg/debuginfo/objfile/testdata/main.c")
                DW_AT_decl_line [DW_FORM_data1] (2)
                DW_AT_type [DW_FORM_ref4]       (0x00000043 "int")
                DW_AT_external [DW_FORM_flag_present]   (true)

0x00000043:   DW_TAG_base_type
                DW_AT_name [DW_FORM_strp]       ("int")
                DW_AT_encoding [DW_FORM_data1]  (DW_ATE_signed)
                DW_AT_byte_size [DW_FORM_data1] (0x04)

0x0000004a:   NULL
Looking at this output, we see the compilation unit, which is the top level unit, and right underneath it a `DW_TAG_subprogram`, which is our `main` function. It has an attribute called `DW_AT_low_pc` with the form `DW_FORM_addr` (which means it is a `uint64`), that describes the start of our function's memory range, as well as the `DW_AT_high_pc` with the form `DW_FORM_data4` (which is also a `uint64`), the end of our function's memory range. And lastly, important for symbolization is the `DW_AT_name` attribute with the form `DW_FORM_strp`, which is a string.
Essentially what this means for symbolization: Thanks to this entry, we know that if we encountered a memory address between `0x0000000000201e20` and `0x00000016`, then it would be the `main` function.
Typically, that's the form that we expect to see, a clear range of memory addresses, and associated metadata about the function that covers that address range.
Introducing the trouble
The memory address that I was debugging of the postgres binary was `0x00a90dca`, and just like in the above primer on DWARF I used the `dwarfdump` tool and search through it with `vim` and `grep`:
$ dwarfdump --show-form postgres-debuginfo > postgres-debuginfo.dwarfdump[1] 26263 segmentation fault dwarfdump --show-form postgres-debuginfo > postgres-debuginfo.dwarfdump
Oh no! This was a first for me with the `dwarfdump`: SEGFAULT!
Alright, pulled up my sleeves and started writing some Go code to see how far I can go:
package mainimport ("debug/dwarf""debug/elf""fmt""log""os")func main() {f, err := elf.Open(os.Args[1])if err != nil {log.Fatal(err)}d, err := f.DWARF()if err != nil {log.Fatal(err)}r := d.Reader()r.Seek(0x00a90dca)dwarfEntry, err := r.Next()if err != nil {log.Fatal(err)}dwarfField := dwarfEntry.AttrField(dwarf.AttrName)fmt.Printf("%x (type: %T, class: %s)\n", dwarfField.Val, dwarfField.Val, dwarfField.Class.GoString())}
And run it:
$ go run main.go postgres-debuginfo467f8 (type: int64, class: dwarf.ClassStringAlt)
Alright! That worked well enough. But what's that? The class (or "FORM" as DWARF calls it) is `ClassStringAlt`, not as usual `ClassString`. The thing that finally pointed me into the right direction was a code comment in the package:
// Extensions for multi-file compression (.dwz)// http://www.dwarfstd.org/ShowIssue.php?issue=120604.1formGnuRefAlt format = 0x1f20formGnuStrpAlt format = 0x1f21
Once I started reading the proposal to extend the DWARF standard, it started to make some sense. The proposal came from a tool called DWZ, which attempts to deduplicate as much data as possible within DWARF debuginfos, which it turns out is extensively used by Fedora packages. This is making more sense now!
One of the optimizations that DWZ performs is splits the original debuginfo data into two files, a primary piece of debuginfo as well as a supplementary debuginfo file. And then when in the primary debuginfo the `DW_AT_name` field is of form `DW_FORM_strp_alt` then it contains an offset that points to a string table in the supplementary debuginfo file, at which to read a null-terminated string.
Alright! But there is just one problem, we only get a single file from the `debuginfod` server, which appears to be the primary piece of debuginfo, so how do we get the supplementary file? The DWARF extension proposal suggests that there is a `.gnu_debugaltlink` ELF section inserted into the primary debuginfo that will link us to the supplementary debuginfo, but there is no documentation whatsoever on this section's format. So I decided to just dump it and see what I can find:
$ readelf --hex-dump=.gnu_debugaltlink postgres-debuginfo

Hex dump of section '.gnu_debugaltlink':
  0x00000000 2e2e2f2e 2e2f2e64 777a2f70 6f737467 ../../.dwz/postg
  0x00000010 72657371 6c2d3134 2e332d32 2e666333 resql-14.3-2.fc3
  0x00000020 362e7838 365f3634 00eecc2e 3b97bfde 6.x86_64....;...
  0x00000030 0244ea93 c67cc39f 324069f1 7f       .D...|..2@i..
A relative path?! We downloaded this from a `debuginfod` server, how could a relative path possibly work? It does not: turns out this is only useful when installing debug packages, such as `postgres-debug`. Then both files are installed and the relative path is adhered to.
So at this point I was clueless, and once I felt like I was not going to find any further useful data myself, I thought of the one place on the internet that should be able to help me: `#elfutils` on Freenode! Once I got there, and described what I was looking at, within 5 minutes, I spoke to none other than Mark Wielaard (aka mjw), one of the elfutils maintainers. He knew the missing piece to the puzzle:
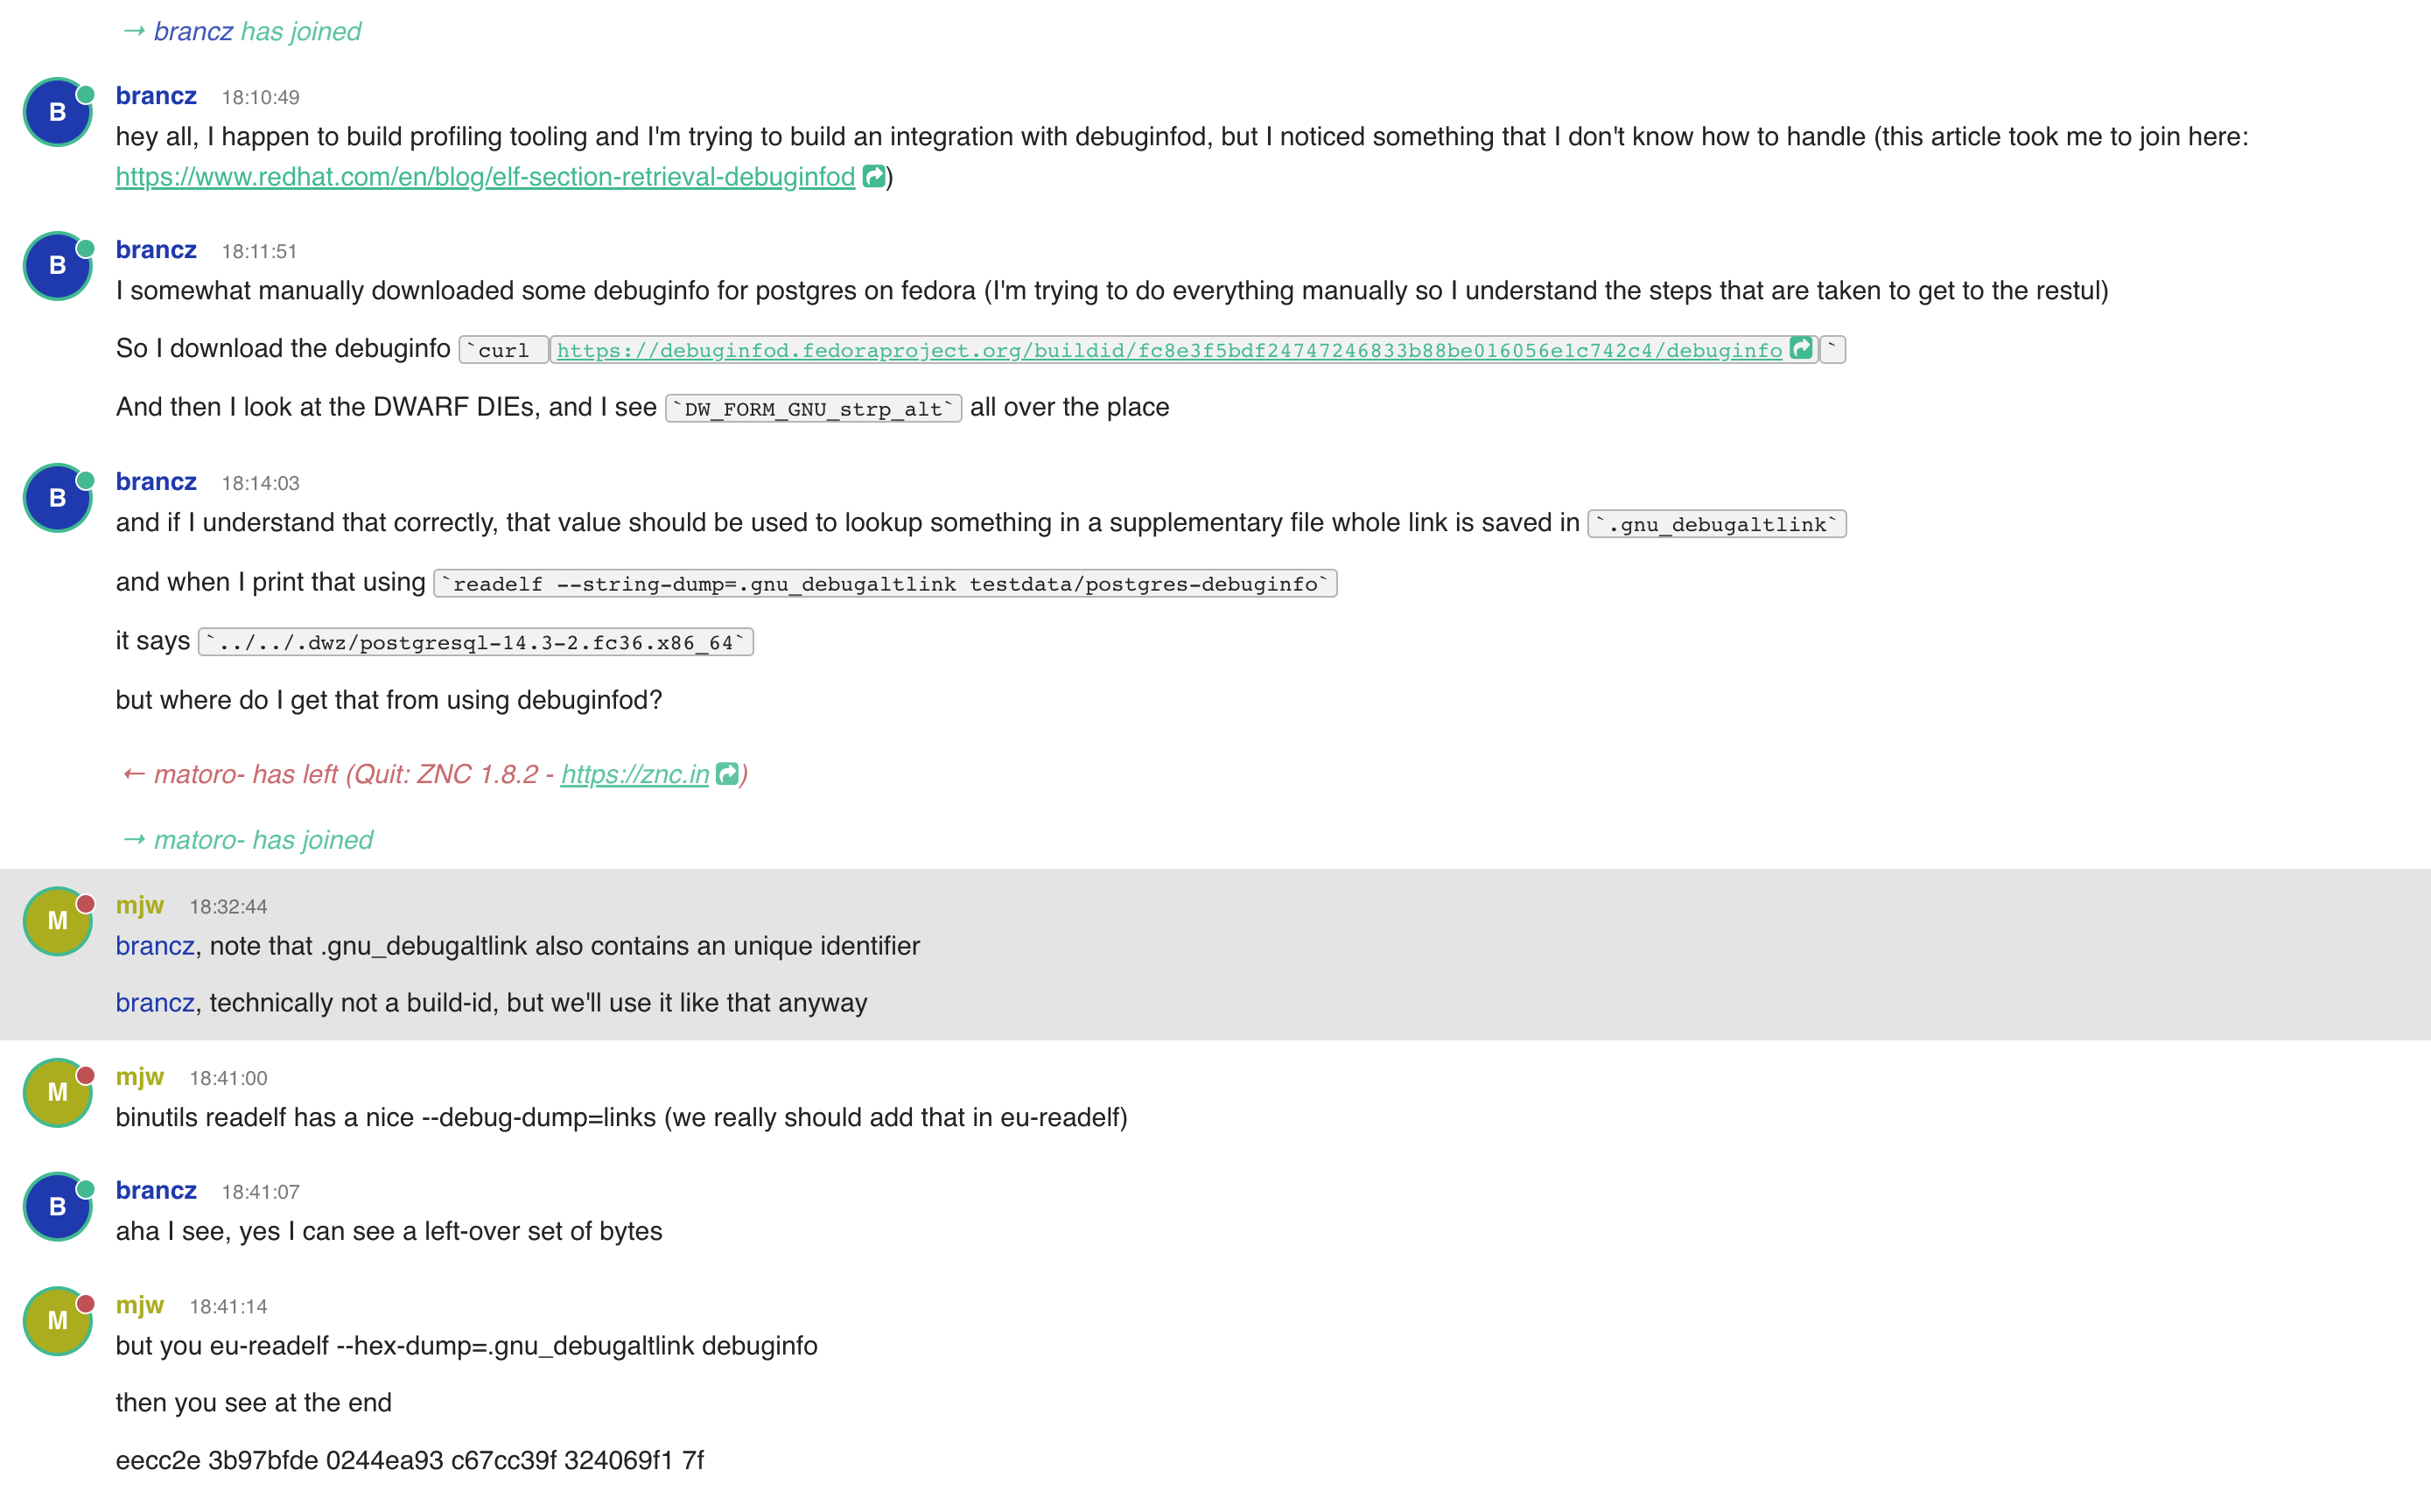
Screenshot of a conversation on IRC explaining how to correctly interpret the bytes in a `.gnu_debugaltlink` section
Aha! The last 20 bytes of the `.gnu_debugaltlink` are an identifier! And they can be used to request the supplementary debuginfo from the debuginfod server!
curl https://debuginfod.fedoraproject.org/buildid/eecc2e3b97bfde0244ea93c67cc39f324069f17f/debuginfo > postgres-supplemental
Now we finally have all the pieces! Remember that value that we managed to print thanks to the Go code we have written? It gave us the value `467f8`.
Now we can finally take that offset and read the string from the supplemental file:
$ readelf --string-dump=.debug_str postgres-supplemental | grep 467f8[ 467f8] brin_new_memtuple
Finally! We've successfully symbolized it.
Learning
Sometimes you won't be able to find all the information you need to accomplish your task documented, learn where to go to find them, or who to ask to figure it out, it's one of our most useful skills!
Shout out to Mark Wielaard for putting the puzzle pieces together for me!